The cheapest premium looked great—until care happened
On paper, the cheapest premium is the one that feels “responsible,” especially when income is irregular and the subsidy math already feels shaky. But the first time something real lands—an MRI, a specialist visit, a prescription that isn’t generic—the plan stops being a monthly line item and turns into a cash-flow problem. The friction is that Marketplace shopping screens tend to reward premium-first thinking, even though most of the financial risk shows up later and in bigger chunks.
When I compare plans, I want the tool to force an early reality check: a side-by-side view that keeps premium after subsidy and likely out-of-pocket in the same frame. If it can’t show how fast a deductible is reached, what a few common services cost before coinsurance, and how that stacks against the “cheap” premium, it’s basically nudging the wrong decision.
Subsidy-aware premium views that handle income swings
The next snag is that the “after-subsidy” premium you’re reacting to is usually based on a single income guess, frozen in time. For self-employed work, a good month and a bad month don’t just change cash flow—they change the premium you should be bracing for, and the payback risk at tax time. A comparison tool earns its keep when it treats subsidy as a moving input, not a one-time checkbox.
I look for a premium view that makes the subsidy assumptions loud and editable: household income, household size, and whether the number is monthly or annual. Even better is a slider or a few saved income points (for example, “base,” “upside,” “downside”) that instantly re-ranks plans by net premium. The constraint here is timing: if you only notice in September that income is trending higher, you can’t retroactively change eight months of withheld subsidy—you can only adjust going forward and plan for reconciliation.
Most importantly, the tool should keep the premium changes on the same screen as cost exposure. If a slightly higher premium plan becomes cheaper after subsidy at one income level but not another, that’s not a minor detail—it’s the whole decision.
One-page cost sharing that doesn’t hide exposure
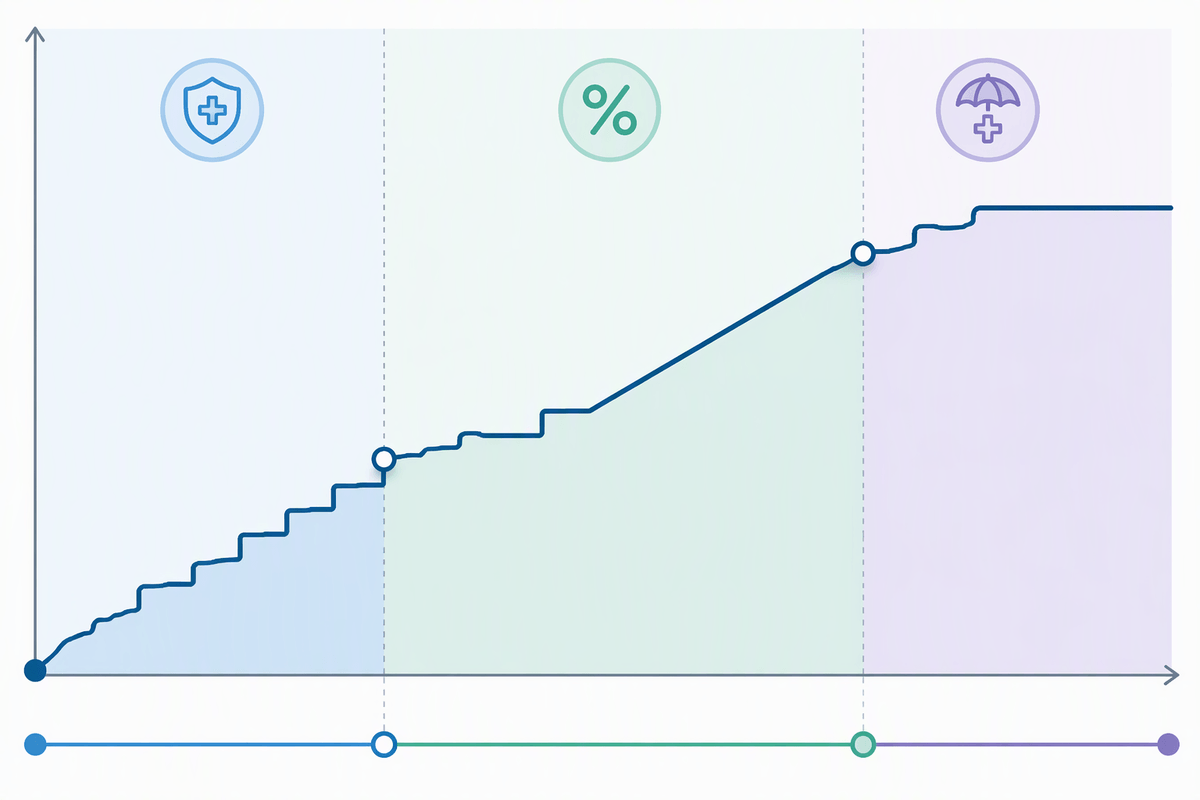
Once the premium view is honest about subsidy drift, the next trap is how cost sharing gets scattered across tabs and footnotes. That’s where people end up anchoring on “$0 primary care” while missing the bigger exposure: a separate deductible for drugs, coinsurance that kicks in after the deductible, or an out-of-pocket maximum that’s miles apart between two plans that look similar monthly. The constraint is attention and time—if it takes ten clicks to reconstruct how a year could go, it won’t get done.
I want a single, printable cost-sharing page that forces the full shape of risk into view: deductible (medical and drug, if separate), what’s exempt from it, specialist and imaging terms before and after deductible, ER rules, inpatient coinsurance, and the out-of-pocket maximum with a clear note on what counts. Bonus points if the tool highlights “step changes” in liability—like the exact moment a plan shifts from copays to coinsurance—because that’s where budgets break, not in the fine print.
Doctor, hospital, and drug checks that stay consistent
After I’ve mapped the cost-sharing shape, the next failure mode is simpler: the plan only works if the care actually routes through it. Network lookup tools are often flimsy—different search pages, different naming conventions, and “in-network” labels that don’t distinguish between a hospital system and the specific facility that bills. The constraint is time: if the directory is messy, people stop verifying, then discover the miss when the first claim hits.
A comparison tool stays trustworthy when provider, hospital, and drug checks behave like a single system. I want to enter my primary doctor, the two specialists I’m most likely to see, the local hospital I’d actually go to, and my recurring medications once—then have that same list carried across every plan I’m considering. If I toggle income or a usage scenario, those checks shouldn’t reset or silently swap results. And for drugs, it needs the exact strength and dosage, tier, deductible applicability, and any prior authorization or step therapy flags, because “covered” without those details is just another surprise waiting to happen.
Scenario toggles that mimic how your year unfolds

With the plan rules and the network list pinned down, the missing piece is how the year actually behaves: it rarely stays “low use” or “high use” for 12 straight months. I want scenario toggles that are more like a timeline than a single dropdown—something that lets me stack a routine quarter (a few primary care visits and maintenance meds) against a disruption (a new specialist, imaging, a physical therapy run). The constraint is cash flow: the month the deductible gets hit matters almost as much as the annual total.
The best toggles also treat events as deductible triggers, not just line items: “one MRI,” “one outpatient procedure,” “one brand drug added in June,” with an option to shift the month and see how fast I collide with coinsurance and the out-of-pocket maximum. If the tool can’t keep premium after subsidy visible while I flip scenarios, it’s too easy to model medical costs in isolation and miss the real squeeze.
Why the “estimated total” number can still mislead
Even with good scenario toggles, the big “estimated total yearly cost” number can lull you into thinking the decision is settled. It’s usually an average built on clean assumptions: every service billed in-network, no denied claims, no surprise facility fees, and a neat progression through deductible and coinsurance. Real years are messier. One outpatient procedure can drag in separate anesthesiology or lab bills, and the estimate rarely shows how those stack in the same week.
The other blind spot is that the estimate often treats subsidy as settled and premiums as smooth, when the constraint is timing. If income rises midyear, the net premium changes going forward and the tax-time reconciliation can claw back credits already used. So two plans with similar “estimated totals” can feel wildly different: one is steady monthly, the other is a spring-loaded deductible hit plus a later subsidy surprise.
A repeatable workflow to compare plans in 20 minutes
When I’m down to a short list, I stop “shopping” and run the same checklist every time, with a timer. First, I lock three income points (downside, base, upside) and write the net premium for each plan under each point, because subsidy drift is the quickest way to regret a pick. Second, I pin one “routine quarter” and one “disruption month” scenario and note the first month the deductible likely gets hit—cash-flow beats annual totals.
Third, I confirm my saved doctor/hospital/drug list stays in-network on the exact plan variant I’m buying. Then I sanity-check the out-of-pocket maximum and any separate drug deductible, because that’s the ceiling I’m really accepting. If two plans still look close, I choose the one with fewer cliffs: fewer rule changes midyear, fewer hidden thresholds, and a premium I can absorb if income bumps up.